Lineage#
The Lineage tool is one of the core components of SousLeSens, a web application for managing ontologies and knowledge graphs, built on the Semantic Web framework.
It is designed to visualize ontologies and knowledge graph data as dynamic, interactive graphs on a whiteboard interface. The underlying assumption is that users can better understand graphs when they are both visualized and interactively manipulated.
Contents#
UI Overview#
Global Overview#
The Lineage UI is composed of three main elements:
A left panel with 5 tabs: Whiteboard, Classes, Properties,SPARQL and Containers
A left panel with 5 tabs: Whiteboard, Classes, Properties,SPARQL and Containers
A whiteboard to show and manipulate graphs.
A whiteboard to show and manipulate graphs.
A right Pannel with buttons related to the whiteboard, providing basic actions common to multiple tools
The top panel is shared across all tools, but its content varies
depending on the currently selected tool.
Lineage has the most buttons on the top panel, and it includes all
buttons available in other tools. Therefore, the documentation of the
top panel is comprehensive in this section.

a. SousLeSens logo : Redirects to the home page
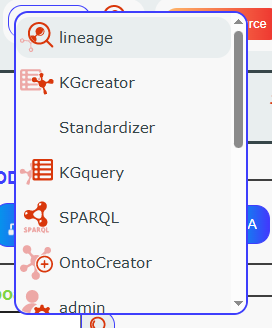
b. Current tool : Switch to another tool
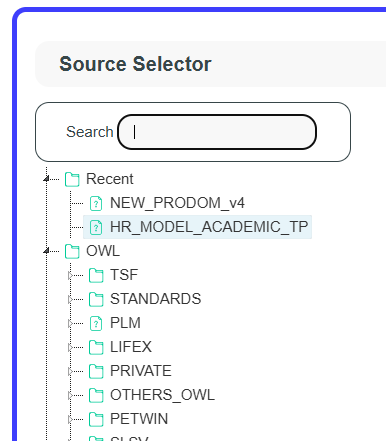
c. Change source : Switch to a different graph
d. Add source : Add an additional graph to explore without replacing the current one
e. All : Select all panel sources as current sources
f. Current sources pannel :
This panel displays all loaded sources. By default, the selected
source is loaded along with its imports. In some tools, imports are
not shown in the panel.
The currently selected sources are highlighted in blue. Click on
another source to change it.
All actions and buttons of the tool will be applied to the current
source.
You can add sources to this panel using (d) and select all sources
using (e).
Using (c) to change the source will clear the panel and reload it with
the selected source and its imports.
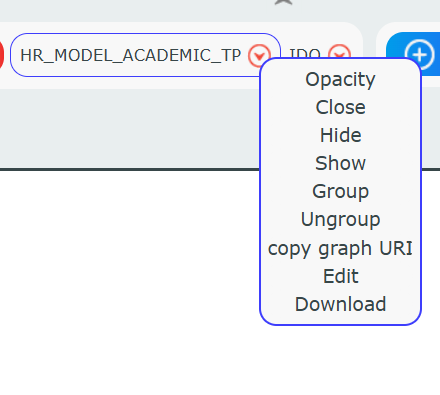
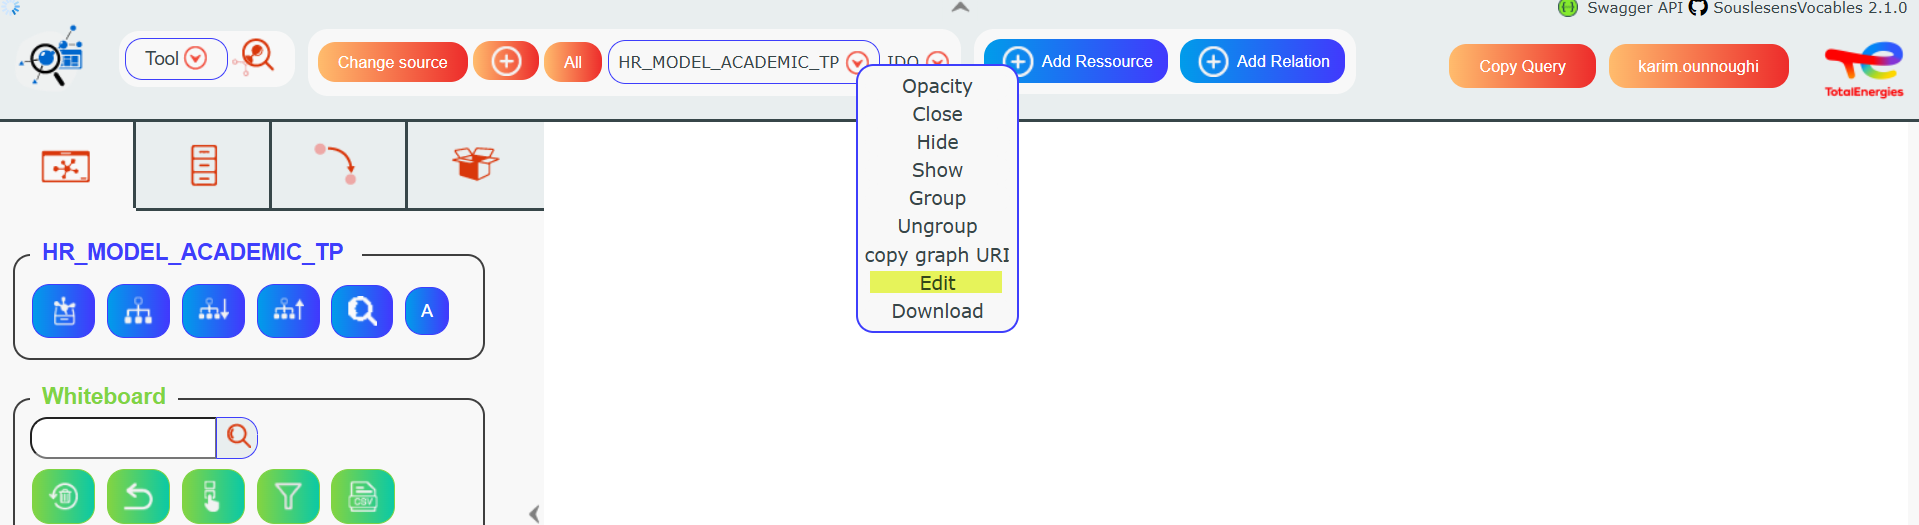
g. Source popup : Clicking this button opens a popup with several
options for the source, such as adjusting node opacity, removing it
from the panel, grouping nodes belonging to the source, copying the
graph URI, or downloading it in a triple format (e.g., Turtle,
RDF).
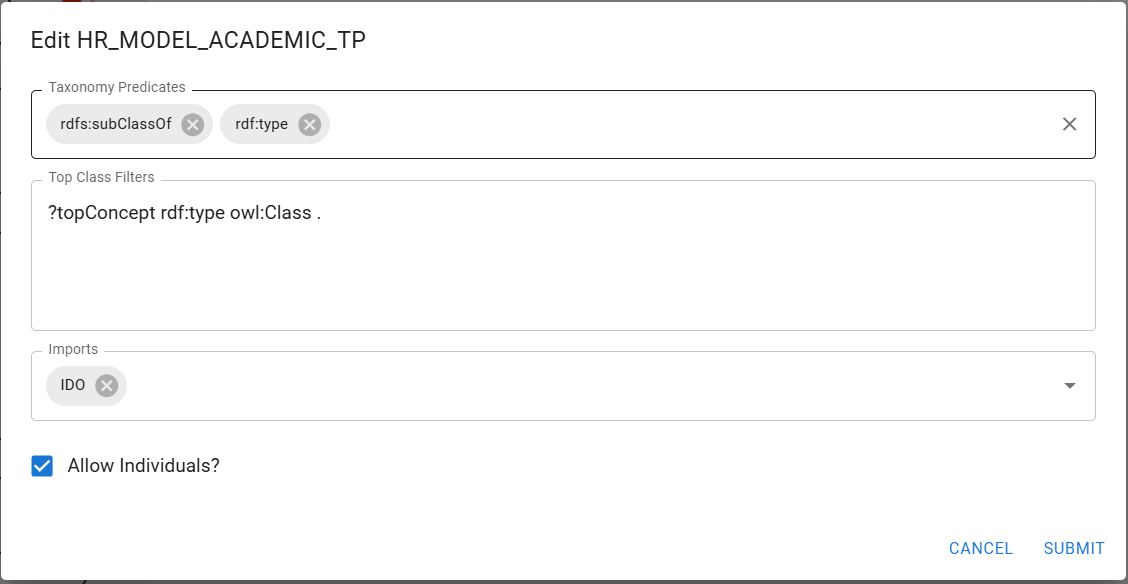
If you are the source owner (creator), you can also edit source
parameters such as child and parent properties, or the main class
query.
h. Add resource : (Lineage only) Adds a new resource. Covered in a dedicated tutorial section
i. Add Relation : (Lineage only) Adds a new resource. Covered in a dedicated tutorial section
j. Change Theme : Changes the color theme of SousLeSens. Administrators can lock a specific theme, in which case this button will not appear
k. Copy Query : Copies the most recent SPARQL query to the clipboard
l. Account button : Displays the logged-in user and allows logout
m. Logqueries checkbox : When checked, all performed queries are logged in the browser console
n. Swagger link : Opens the SousLeSens Swagger UI to view and access all available user API routes
o. GitHub link : Opens the SousLeSens GitHub repository for contributing and read the documentation
Left panel: Whiteboard Tab#
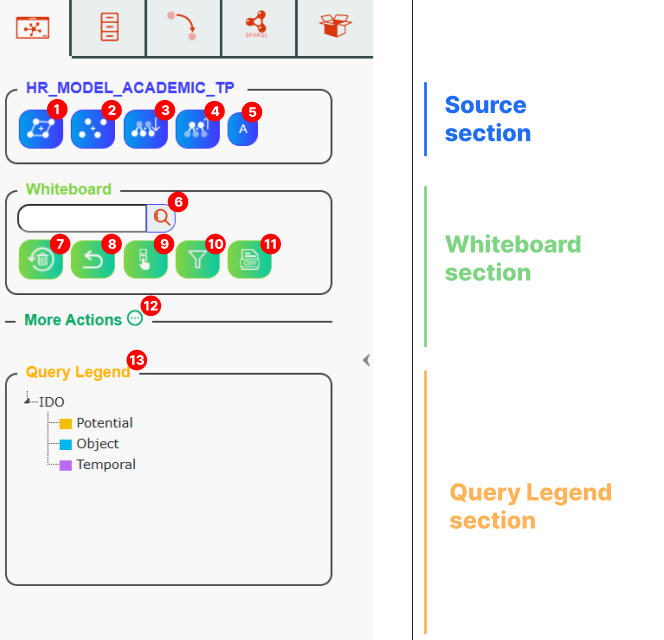
Source section:
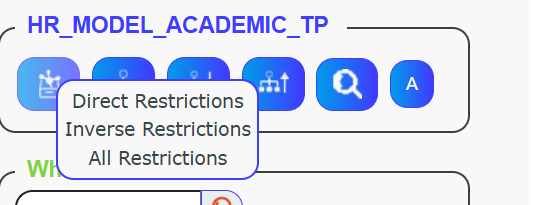
Draw restrictions button – Draws the main classes and their associated restrictions on the whiteboard if the whiteboard is empty.
If the whiteboard already contains nodes, it will draw the restrictions related to the currently selected node.
Right-clicking on the button opens a popup menu that lets you draw restrictions with specific options.
This performs the same action, but limited to either direct, inverse, or all restrictions.
Main classes button : Displays the main classes on the whiteboard. The main classes are those that meet the top classes filter condition (by default, all owl:Class).
This parameter can be edited for each source if you are the source creator.
Children button – Adds all children of the classes currently displayed on the whiteboard.
Children are the elements linked to the current node via taxonomy predicate properties.
For example, if a node is displayed, clicking on “Children” will show on the whiteboard all nodes that are linked to it via rdf:type or rdfs:subclass properties.
Parents button – Adds all parents of the nodes currently displayed on the whiteboard.
A parent is defined by taxonomy predicates as well, but the relationship is reversed.
Axioms button
Displays on the whiteboard all nodes related to an axiom, grouped by axiom category (e.g., SubClassOf, EquivalentClasses, or DisjointClasses).
Whiteboard section
Whiteboard search bar : Searches for a node that is present on the whiteboard.
Clear all button – Clears the whiteboard
Clear last button – Clears all nodes on the whiteboard, except for those added by the most recent action.
Only last button – Clears all nodes on the whiteboard, except for those added by the most recent action.
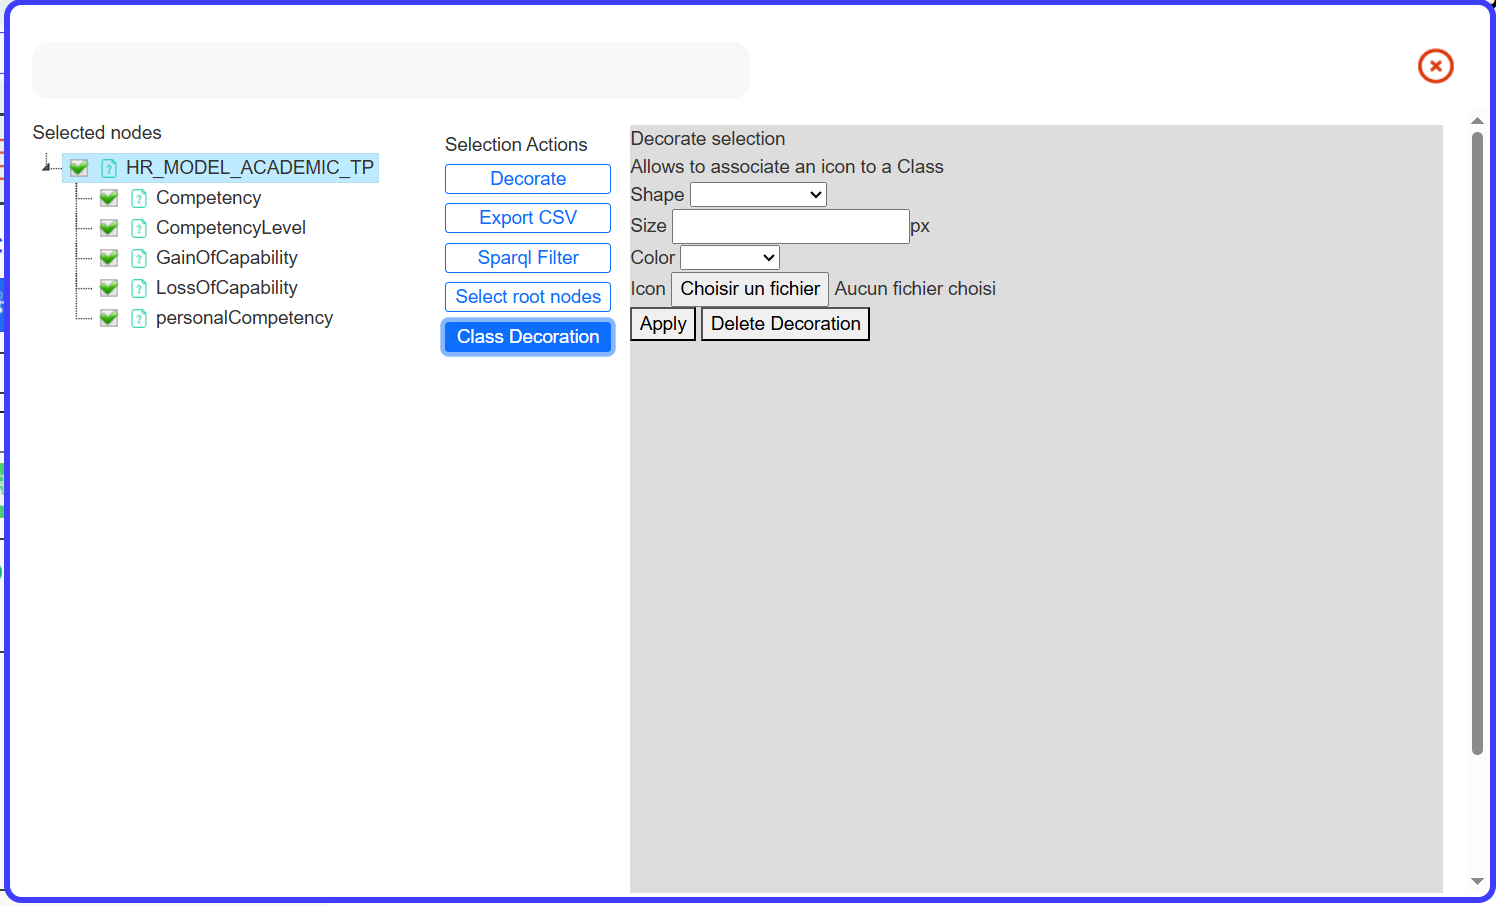
Selection button : Displays a menu with a tree of all classes on the whiteboard. This menu primarily handles node decoration and icon management.
CSV export button : Displays the whiteboard in a table format, which can be exported to a CSV file.
More actions button. Displays an additional set of buttons for using advanced features (see below).
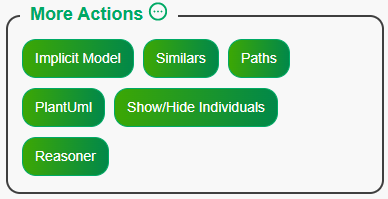
Extra features are revealed when the “More Actions” button is clicked
• Implicit Model: Draws the current source’s implicit model on the
whiteboard, which represents the knowledge graph facts.
• Similars: Displays a menu to show nodes on the whiteboard that
have similar labels to the currently displayed nodes.
• Paths: Retrieves the shortest path between two nodes in the
source.
• PlantUML: Displays the whiteboard in a PlantUML view.
• Show/Hide Individuals: Toggles the visibility of individuals on
the whiteboard.
• Reasoner: Uses a reasoner on the current source to perform
inference, consistency, or unsatisfiable operations, and displays the
results on the whiteboard.
Query legend: Explains the color codes used on the graph. Colors are selected based on the top-level ontology.
Left panel: Classes Tab#
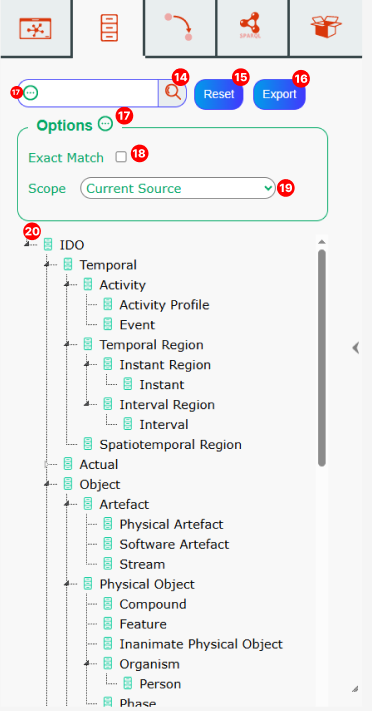
Classes Search Bar – Search for classes within the current source.
Reset Search Results Panel – Resets the search results panel.
Export Search Results Button – Exports the search results.
Hide Options Panel Button – Hides the options panel.
Options Panel: Exact Match Option – If the exact match option is checked, the results must be strictly equal; otherwise, a node containing the search term is sufficient.
Options Panel: Scope Option – By default, the search is performed on the current source. You can also search within the imported sources or all available sources.
Search Results Panel – Results are displayed in a tree format.
Left panel: Properties Tab#
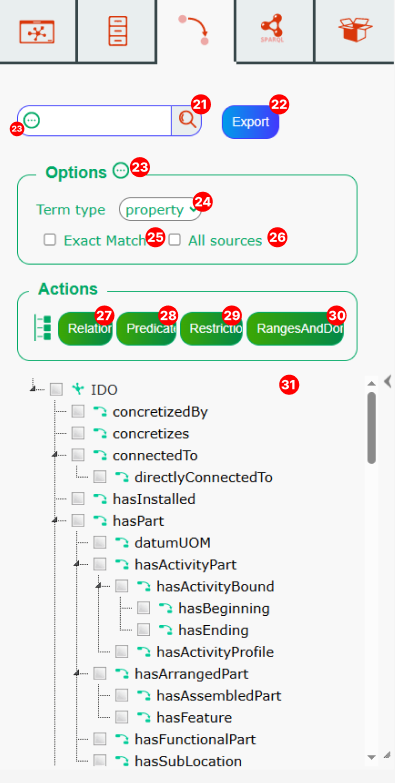
Properties search bar – search for properties
Export search results button
Hide options panel button
Options panel: Term type option - Allows you to filter by term type.
Options panel: Exact match option - If enabled, only exact matches will be shown.
Options panel: All sources option - Search across all available sources.
Actions panel: Relations button - Displays predicates and restrictions.
Actions panel: Predicates button
Actions panel: Restriction button
Actions panel: Ranges and Domains - Displays all ranges and domains for a source. See Ranges and Domains tutorial section
Search results panel
Left panel : SPARQL#
See SPARQL tutorial section
Left panel : Containers Tab#
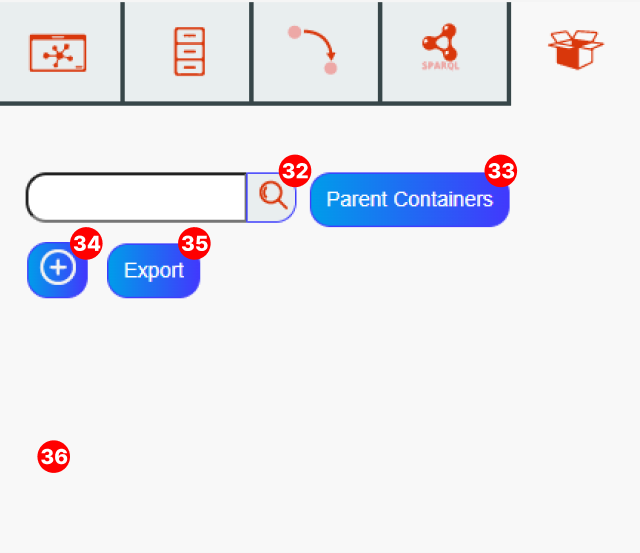
Container search bar – Search for rdfs:Container
Parent containers button : Displays all parent containers on the whiteboard
Create container button
Export containers button
Search results panel
Right Panel : whiteboard buttons#

Clear all button : Clears the whiteboard
Display : Opens a menu to modify the graph display parameters, such as spatialization algorithms, node distance, etc.
Save whiteboard : Saves the current whiteboard for later reuse.
Load saved graph : Load a previously saved whiteboard.
Export whiteboard : Exports the current whiteboard in various formats (GraphML, SVG, CSV, PlantUML, JSON).
Import whiteboard : Imports and displays a whiteboard from a JSON file provided by the SousLeSens JSON export (supports JSON following vis.js network format: https://visjs.github.io/vis-network/docs/network/).
Shortcuts#
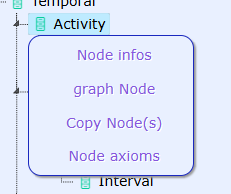
Right-clicking on a node triggers a menu with several options.
“NodeInfos” and “Axioms” are detailed in the tutorial below.
Expand and Parents – These options are equivalent to the
children/parent buttons but apply only to the current node.
Collapse – Removes all child nodes of the current node from the
whiteboard.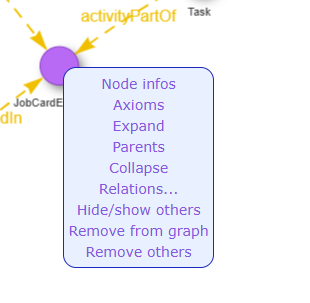
Right-clicking on a search result triggers a popup menu with different options, depending on the current tab and the node that is clicked.
Ctrl + Alt + Click on a Whiteboard Node
Draws all relations of the clicked node.
Shift + Click on a Whiteboard Node
Select a node of the whiteboard. Use it on multiple nodes on whiteboard to select them.
Remove from graph and remove others right click actions will performs on all of them.
The selection can be performed on a large zone with shift + click dragged on a whiteboard zone.
Ctrl + Shift + Click on Search Results Panel
Allows you to select multiple nodes by clicking on them. The right-click
action will be applied to all selected nodes.
Tutorial#
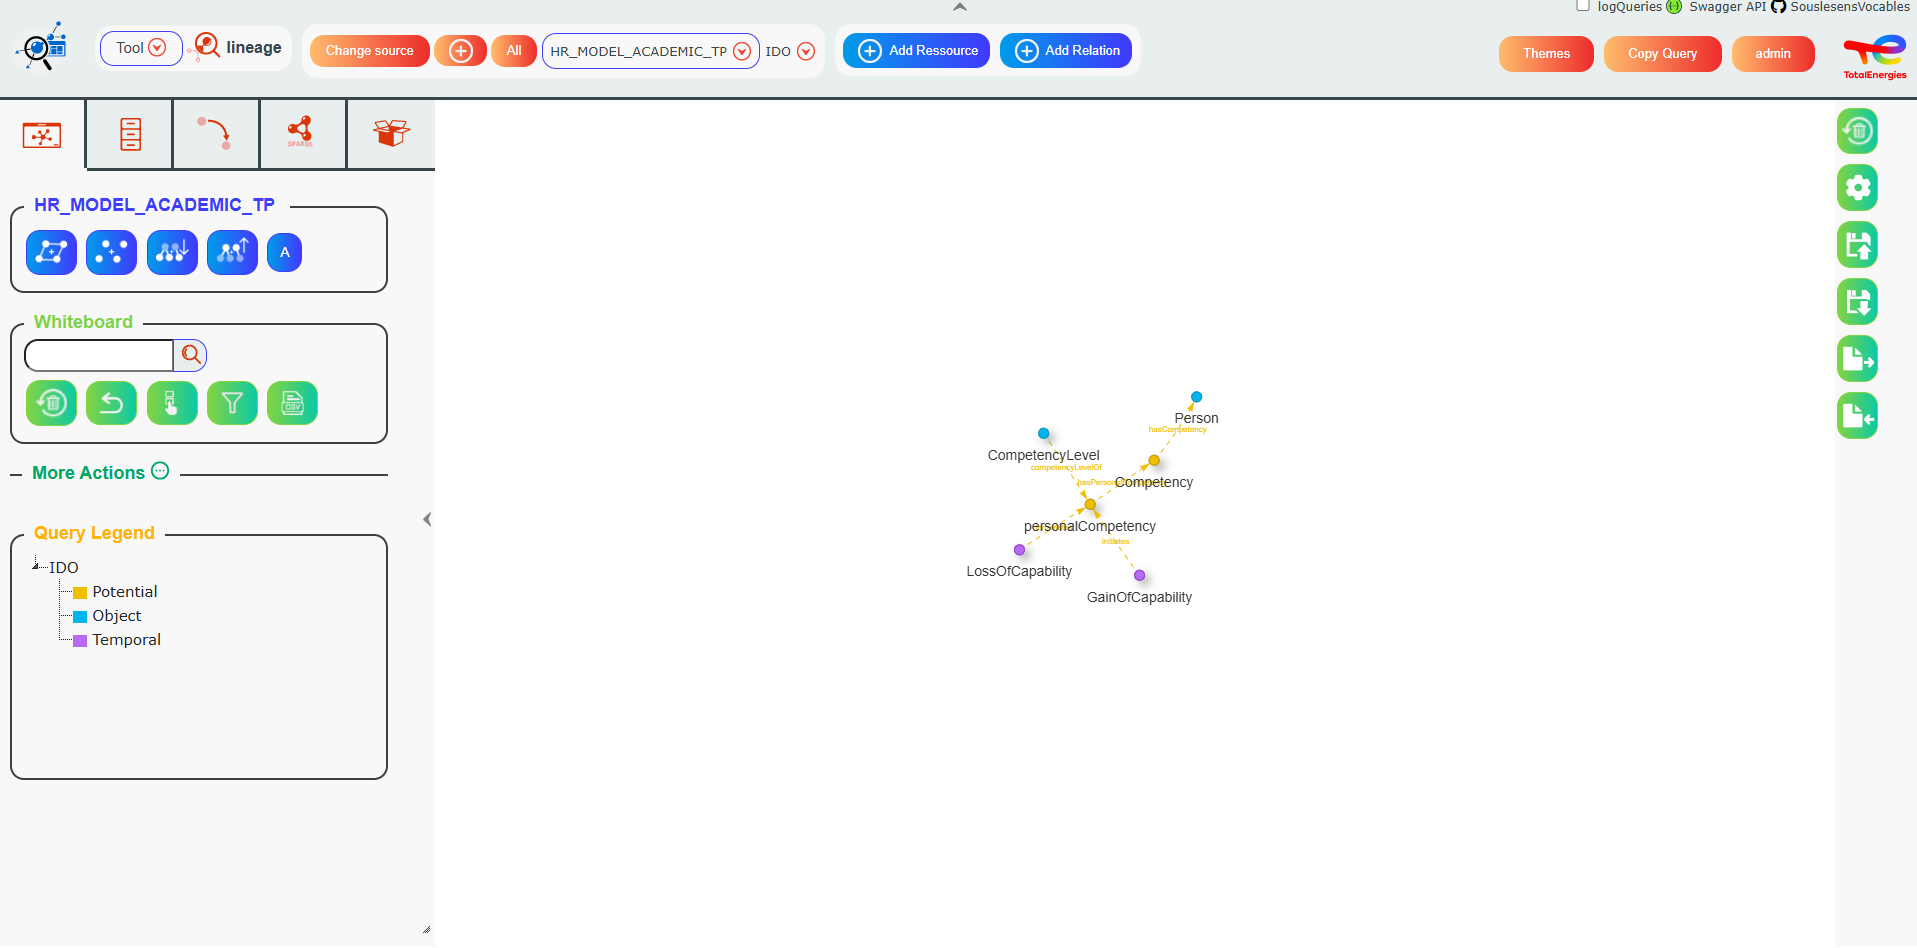
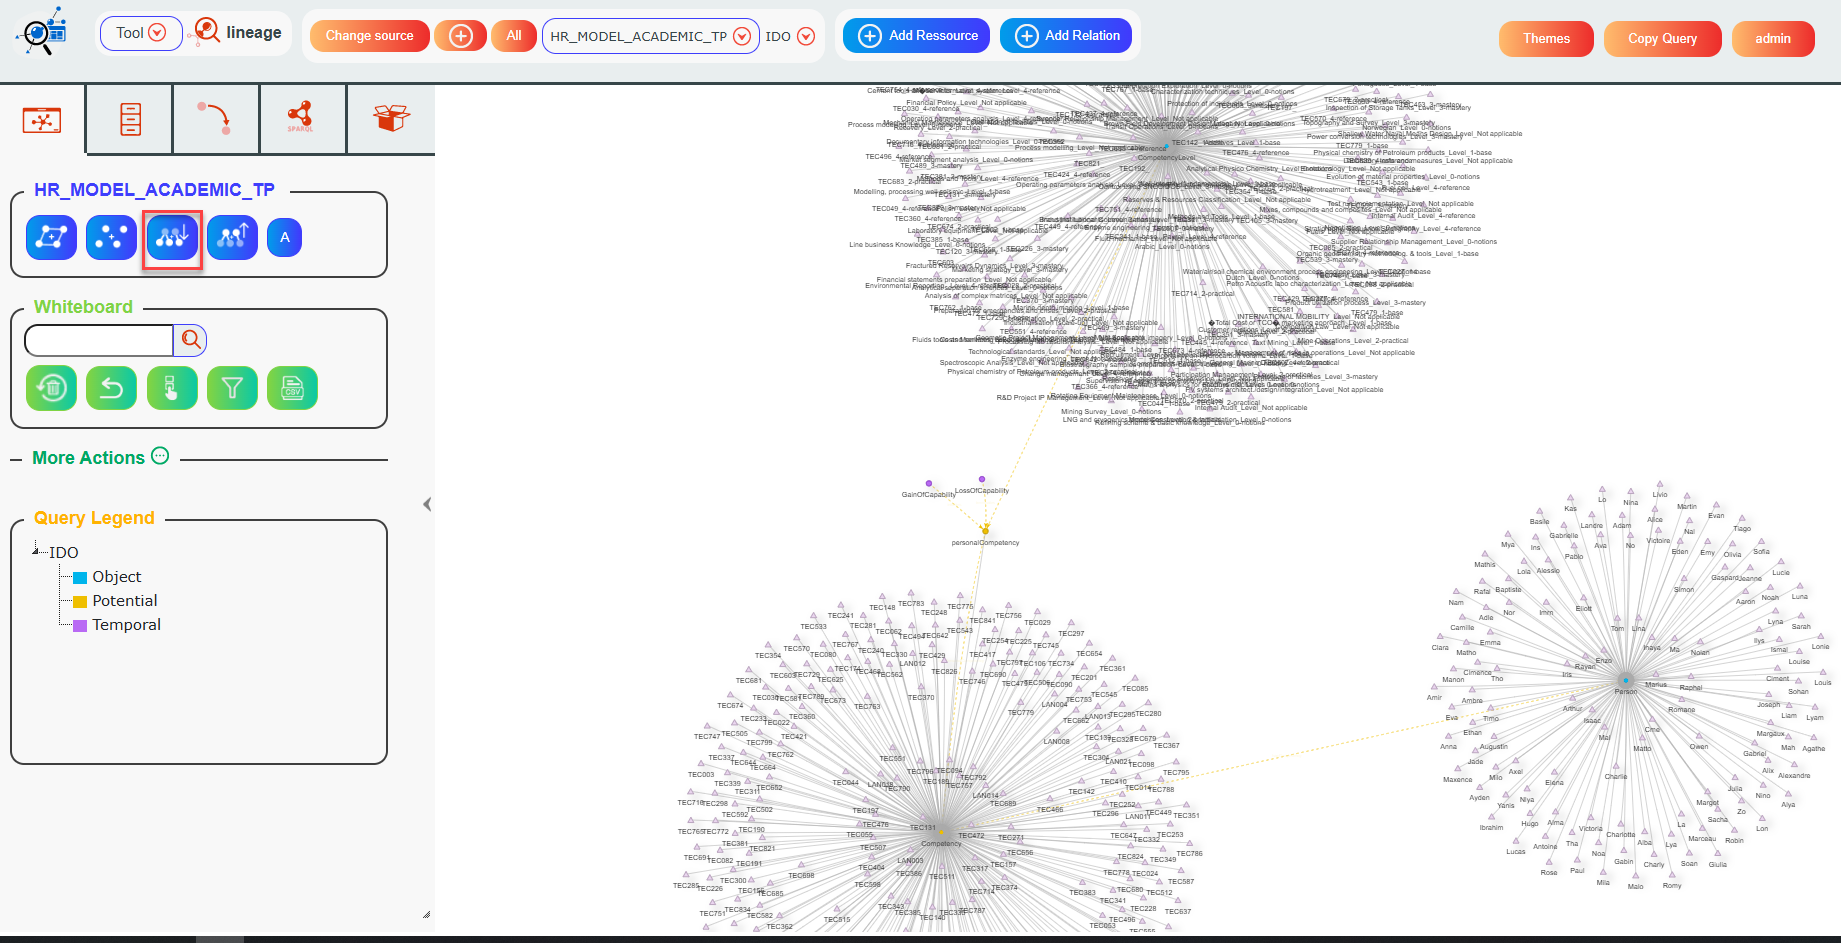
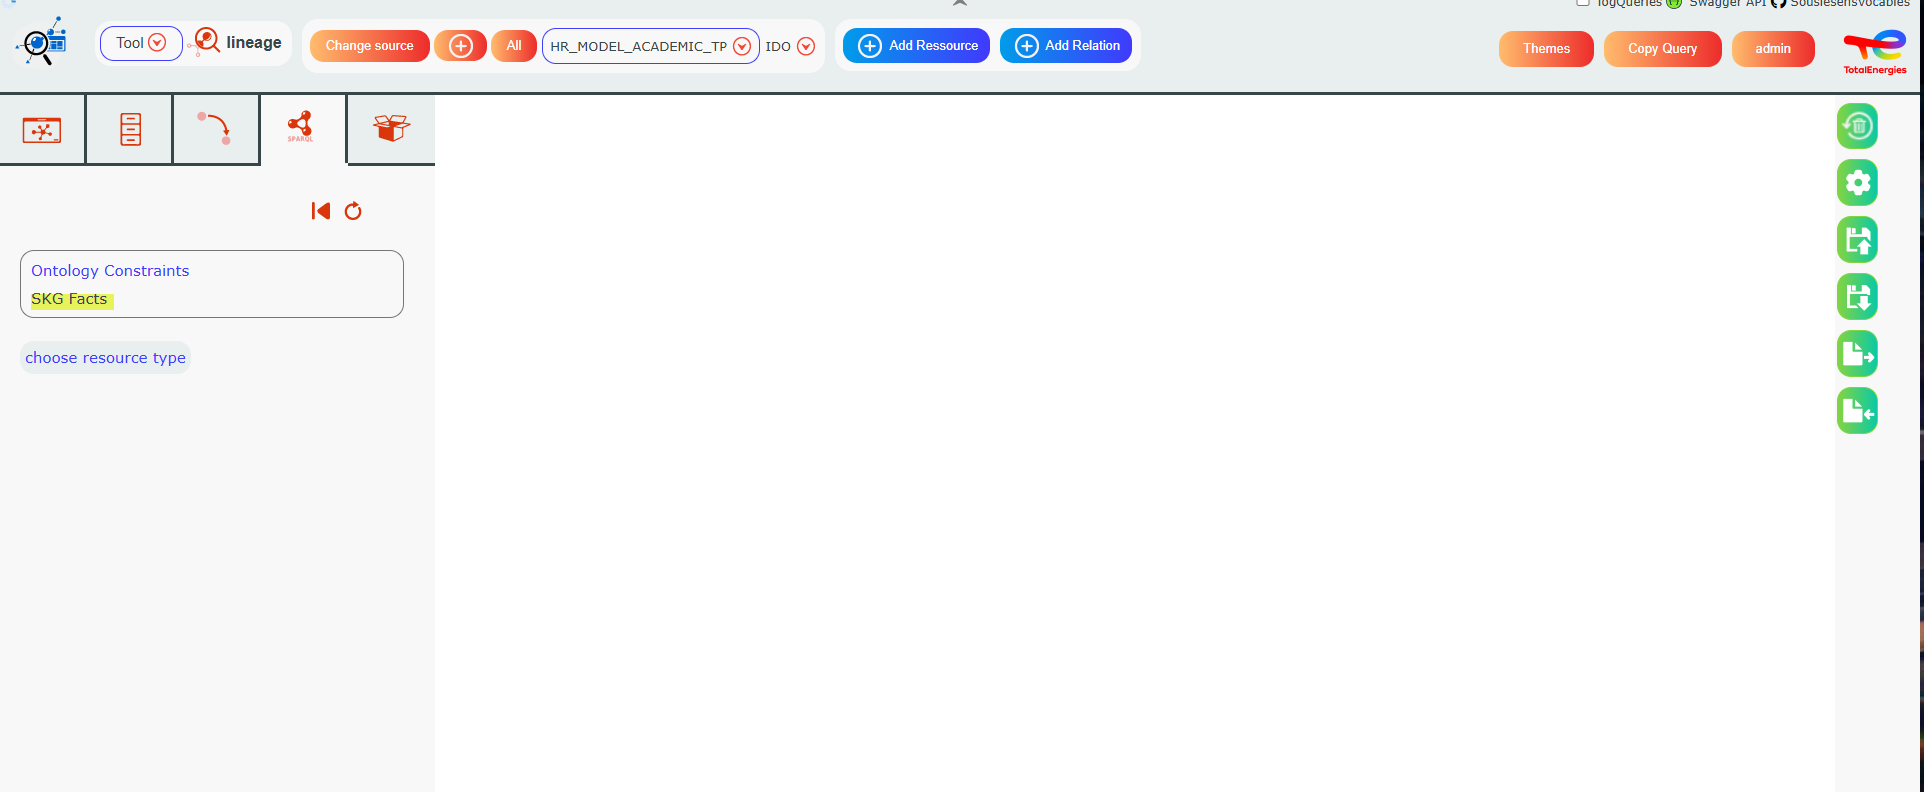
Let’s open the Lineage tool in SousLeSens, and select the source HR_MODEL_ACADEMIC_TP source.
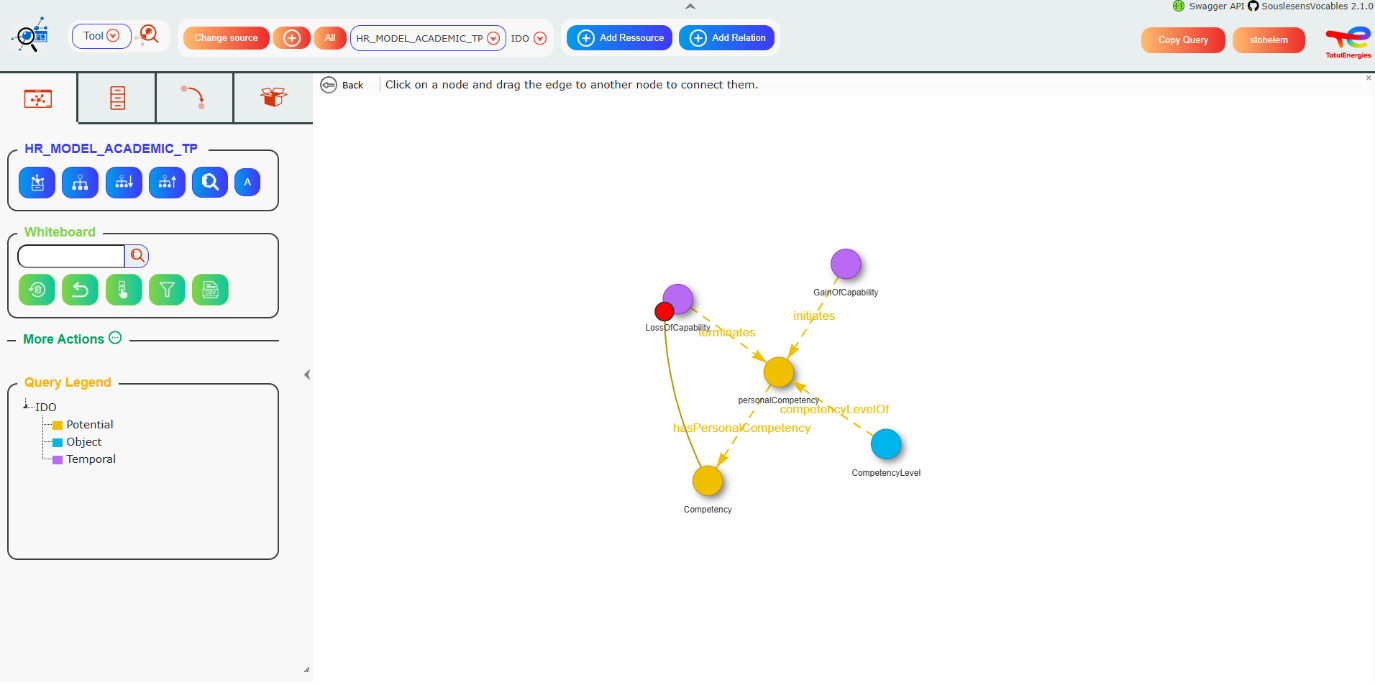
Now, the Lineage tool opens. Click the Model button to show the model on the graph.
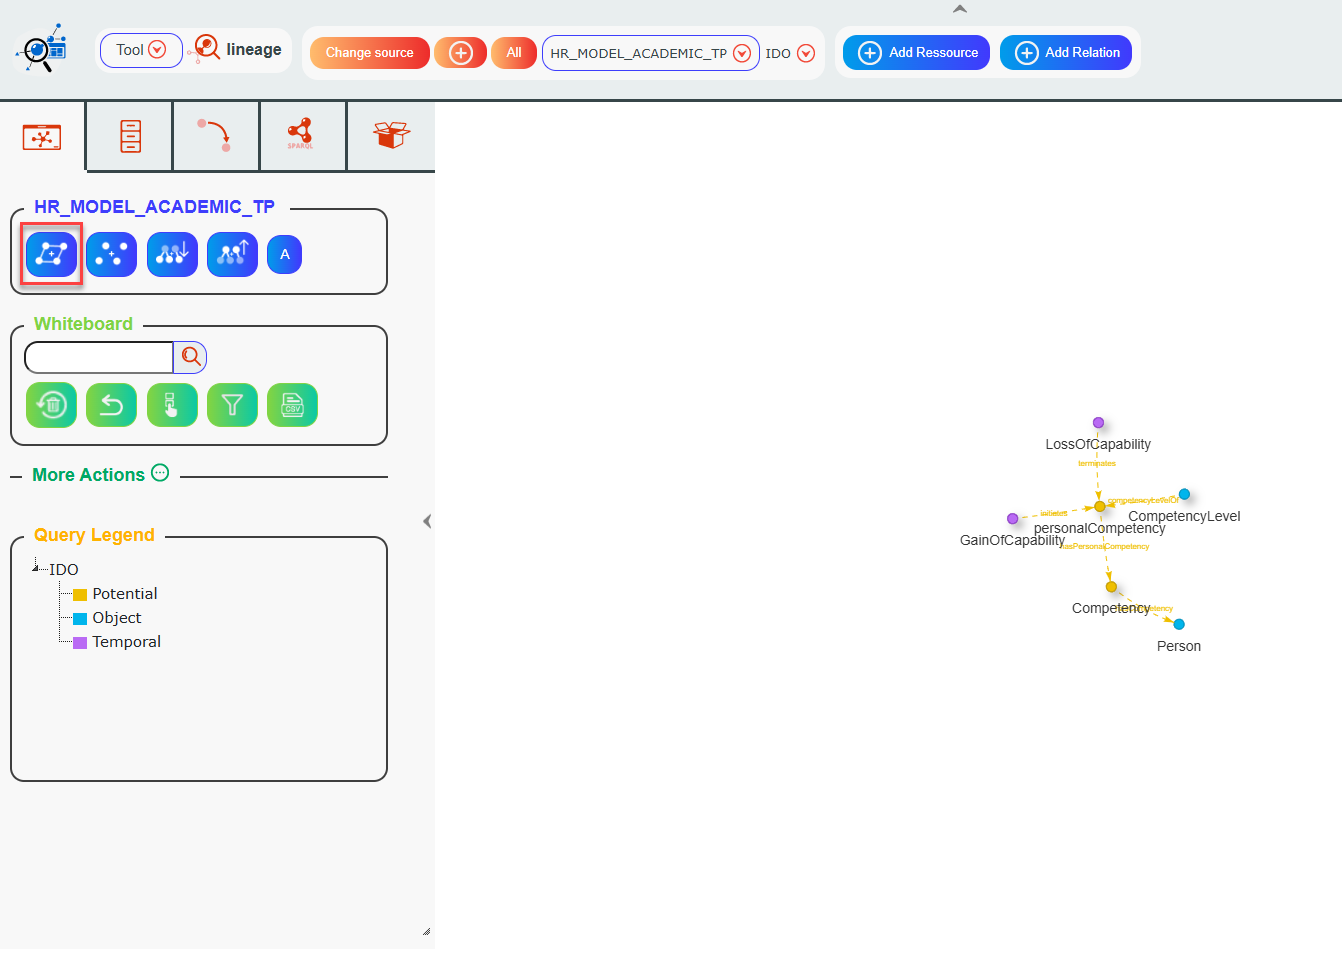
The graph displays the source model graph.
Now if you click the Expand button:
Not only will the model (i.e., the classes) be displayed, but also all the children of the classes on the whiteboard will appear.
If you click the Parents button instead:
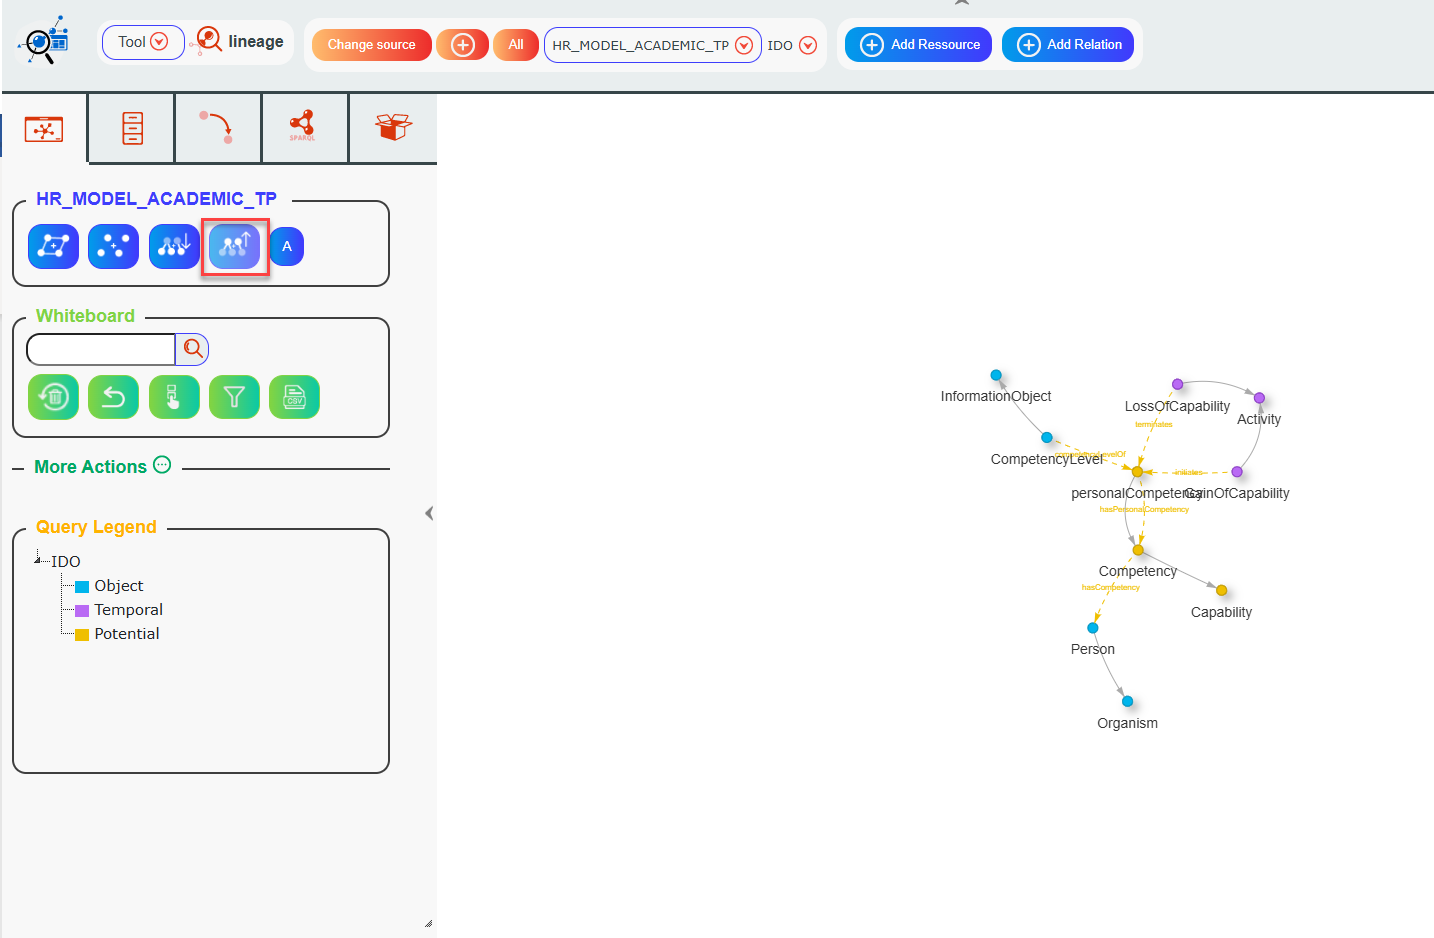
The parent classes of the classes currently displayed will be added to the graph.
The Whiteboard menu allows you to clear the graph, undo an action, display only the most recently added nodes, or export the current graph in CSV format. It also contains a search bar: when searching for a string, all nodes containing the searched string will be highlighted on the whiteboard.
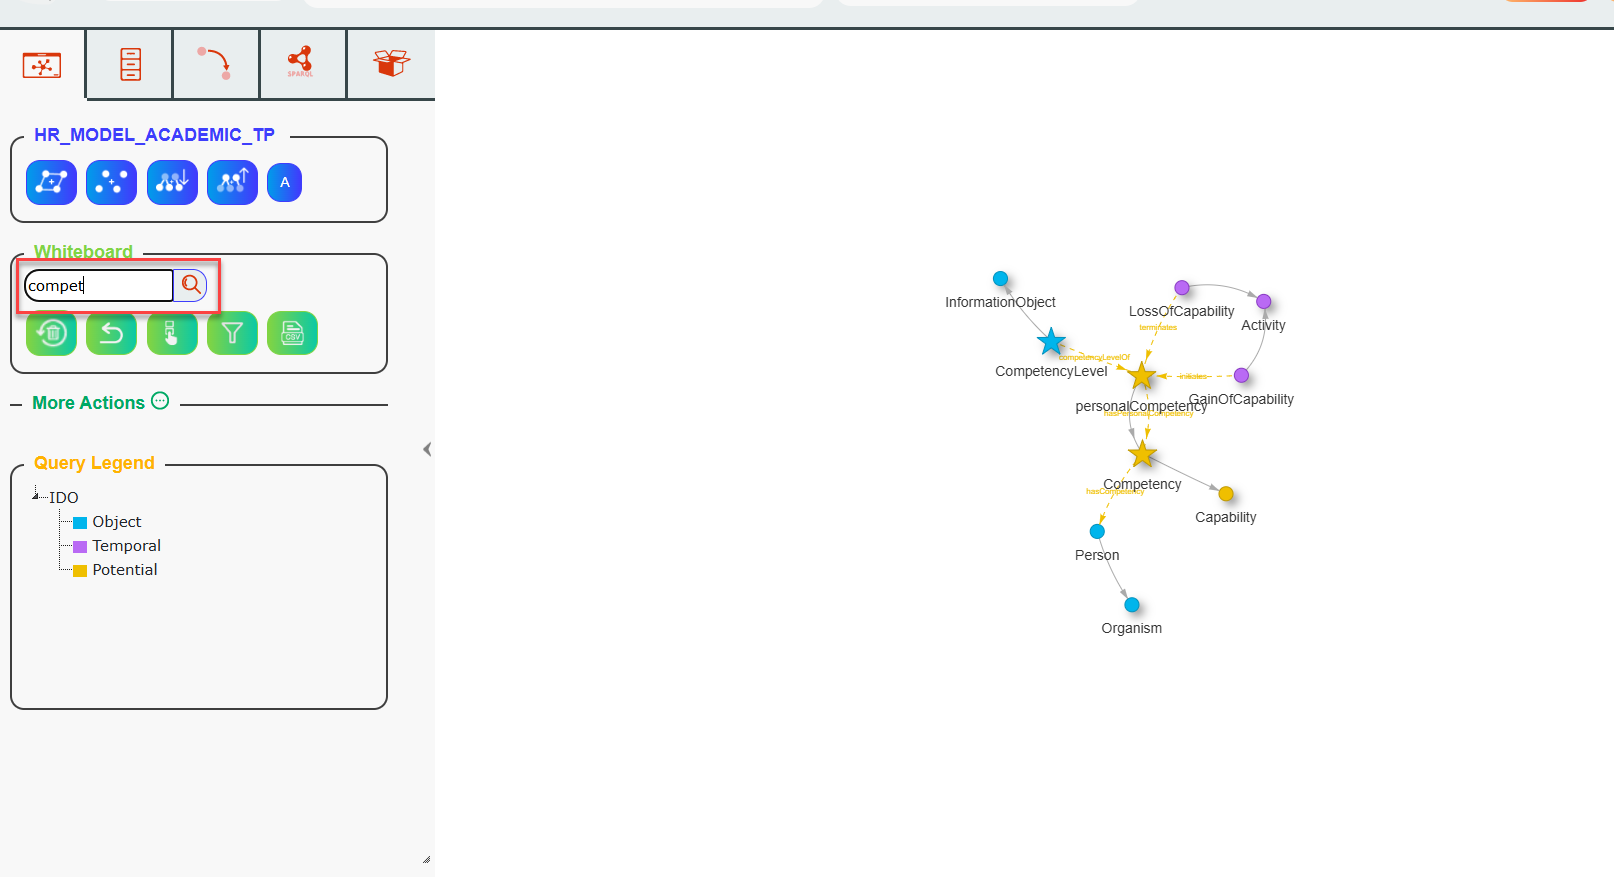
The whiteboard menu – nodes that match the searched string take a star shape
If the displayed graph is large, you can use advanced node search with
the search bar in the Whiteboard section.
Additionally, by right-clicking on a node, you have several options. The
first option is Node Infos, which opens a window displaying detailed
node information.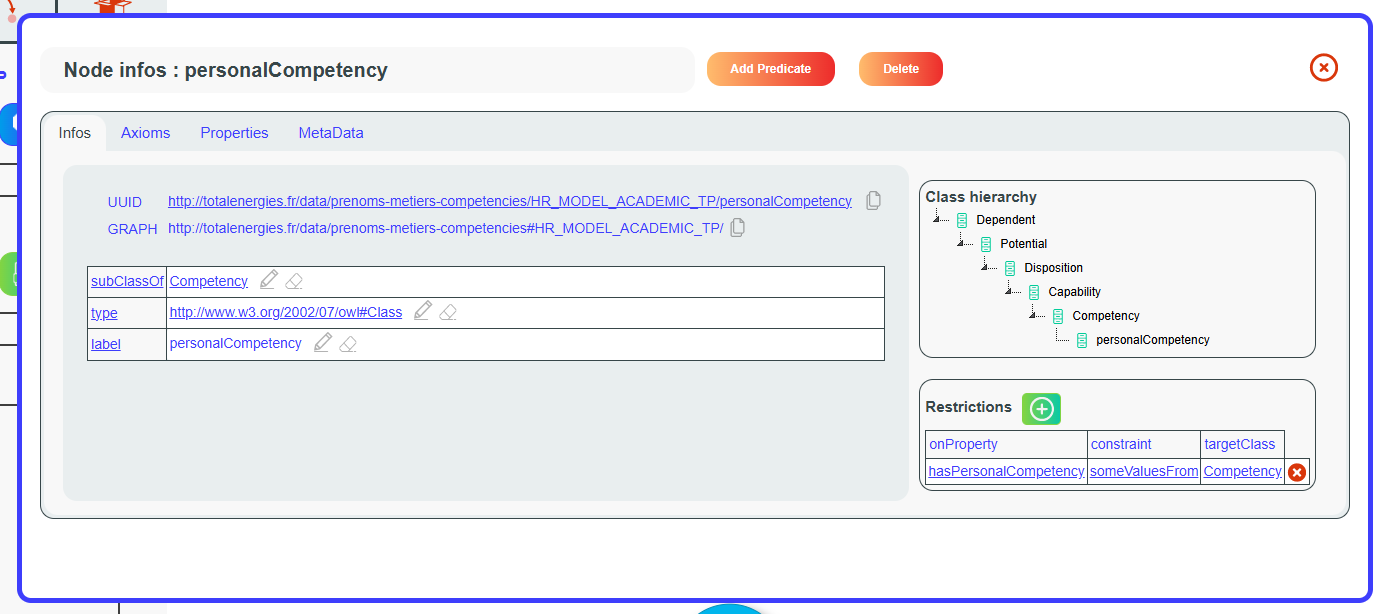
Creating a relation#
By clicking on the Add Relation button in the top toolbar, you can
add a relation between two classes.
A relation is a semantic link between two classes. For example, if there
are two classes, “Worker” and “Project”, you can define the
relation “works on” between “Worker” and “Project”.
In this case, “Worker” is the subject or range of the relation, and
“Project” is the object or domain of the relation. A relation always
goes from subject to object (from range to domain).
To create a relation, simply drag and drop one class onto another.
A window will then open, displaying all relation types that correspond to the selected subject and object types. Choose a relation type, select the cardinality, and your new relation will be displayed on the graph.

Class search#
Using the search bar in the Classes tab in the left panel, you can search for all classes in the source model, not just the classes displayed on the whiteboard.
CSV visualisation#
You can export data in CSV format.
First, the graph displayed on the whiteboard will be rendered as a CSV
file. Each line in the CSV will represent a triple from the graph. To do
this, click the CSV button (12). A window will then open:
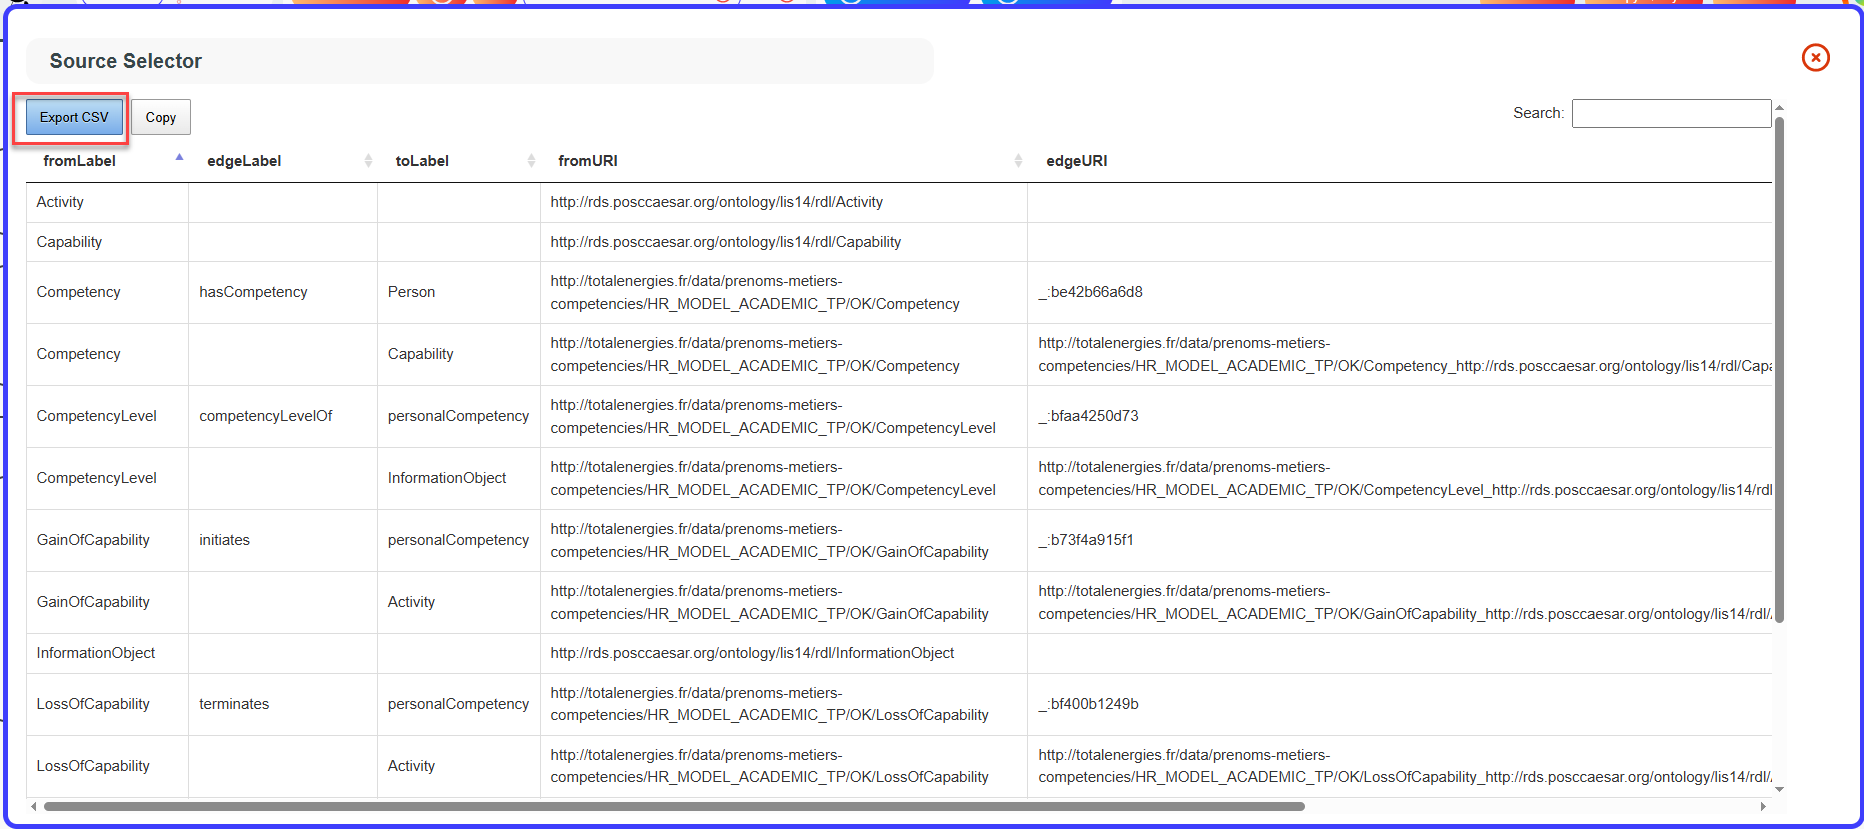
Then click the “Export CSV” button. All data displayed will be saved in CSV format.
You can also export lists of classes and properties, in the Classes or Properties tab of the left panel, and before or after a search. It works the same way: use the Export button in the corresponding tab.
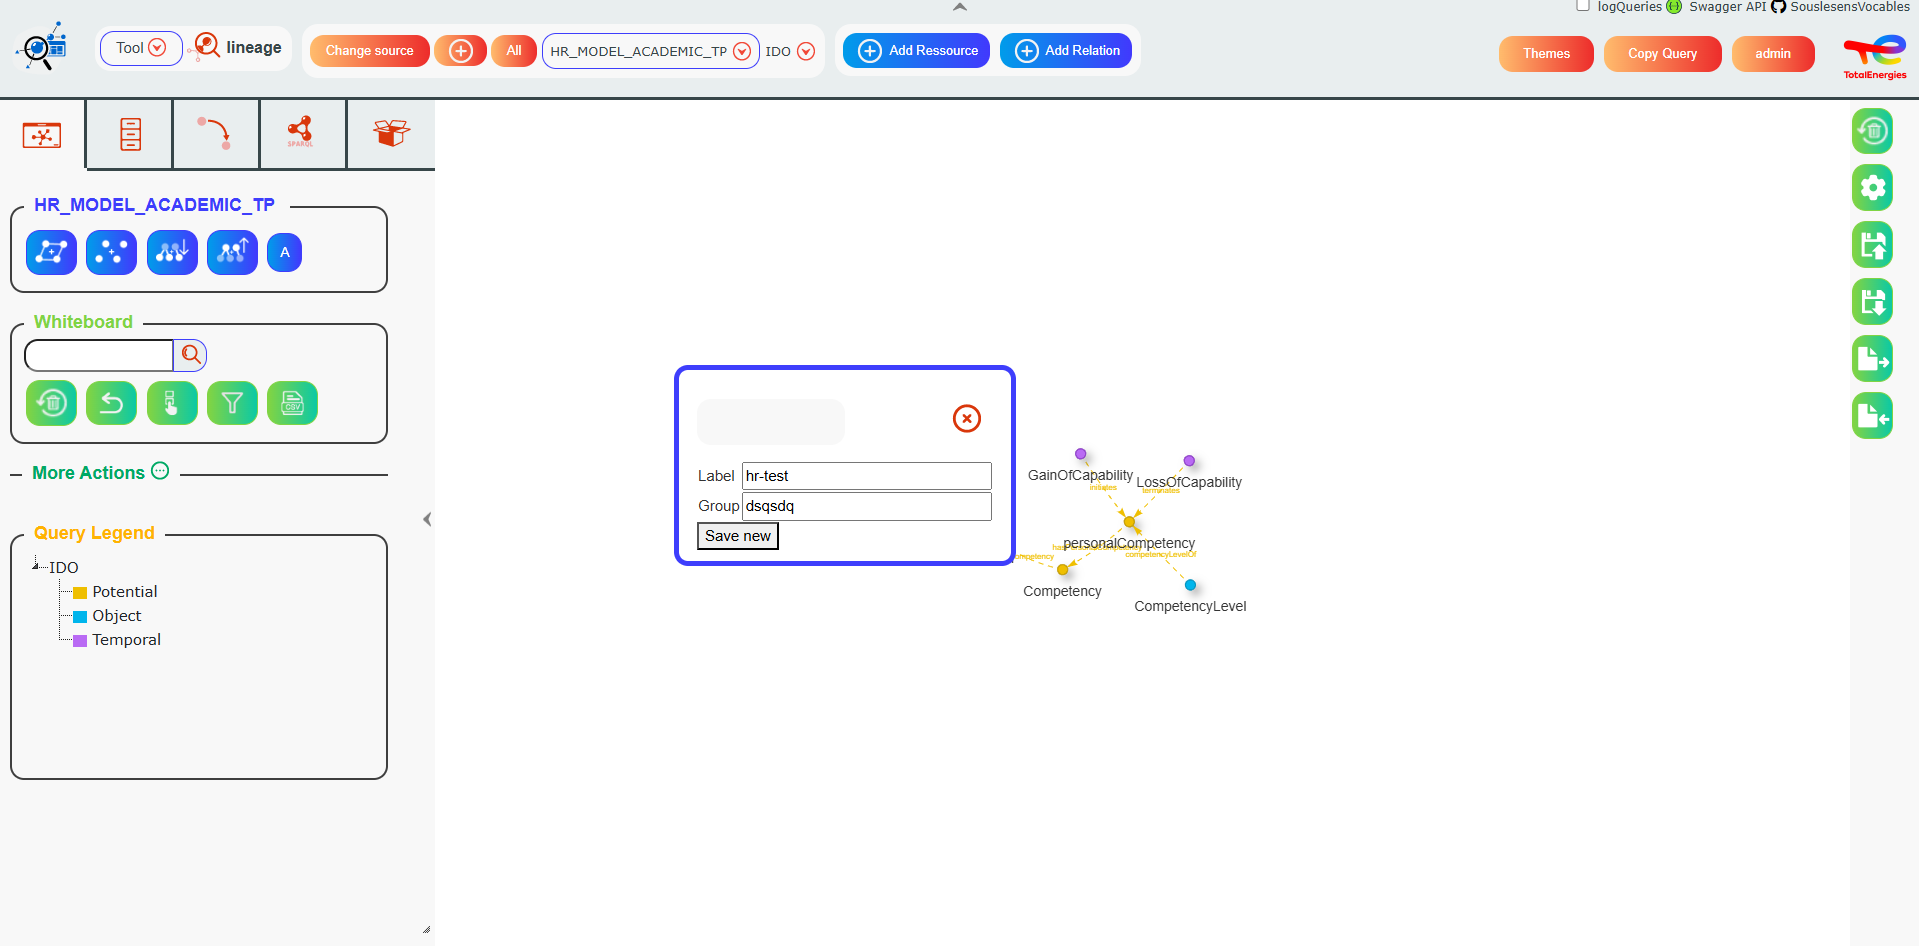
Save and load a whiteboard#
First, click on the Save button (button number on the whiteboard). Then, set a title for your current whiteboard and select a group, which will correspond to a folder path that can contain other whiteboards. A group can contain multiple folders, for example, project_whiteboard/project1, to further organize your whiteboards. These groups are designed to organize your saved whiteboards and make them shareable with other users. After filling in the label and group, the current whiteboard can be saved.
If a whiteboard has been loaded before an update button, will show up to update the last loaded whiteboard.
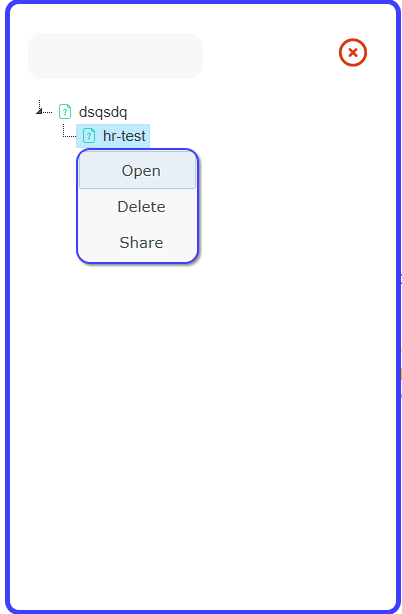
A saved whiteboard can be reloaded by clicking the Load button (on the whiteboard). To do so, simply click on the saved whiteboard you wish to reload.
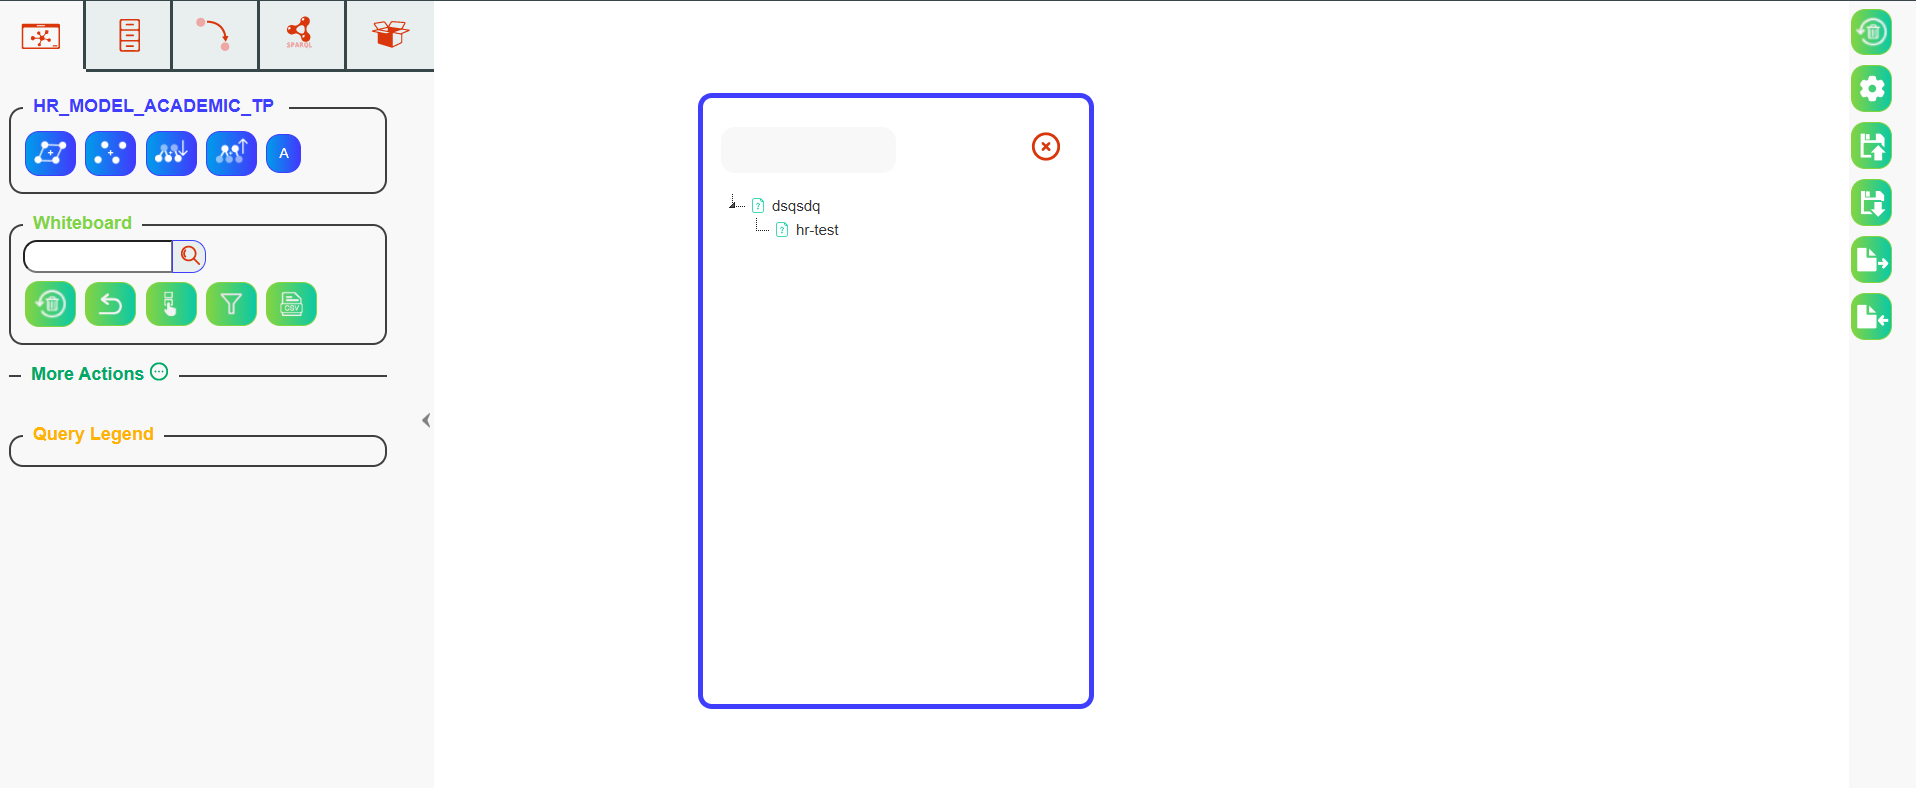
You can also right click on a saved whiteboard to delete or share it.
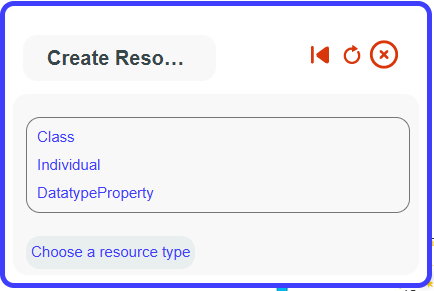
Create a node#
By clicking the Add Resource button on the top toolbar, you can add a node to the graph. This resource will adhere to W3C standards. The resource can be a class, an individual, or a datatype property (definitions: https://www.w3.org/TR/owl-ref/). A guide will walk you through the process depending on the type of resource you want to create. A superclass is required to create a new class, an individual must be derived from a class, and a datatype property needs a range and a datatype (e.g., date, string, int…).
Ranges and Domains#
By clicking on the Ranges and Domains button (30), you can visualize all domains and ranges of the ontology properties graphically. Note that ranges and domains are not defined for every ontology. See below for the ranges and domains of IDO.
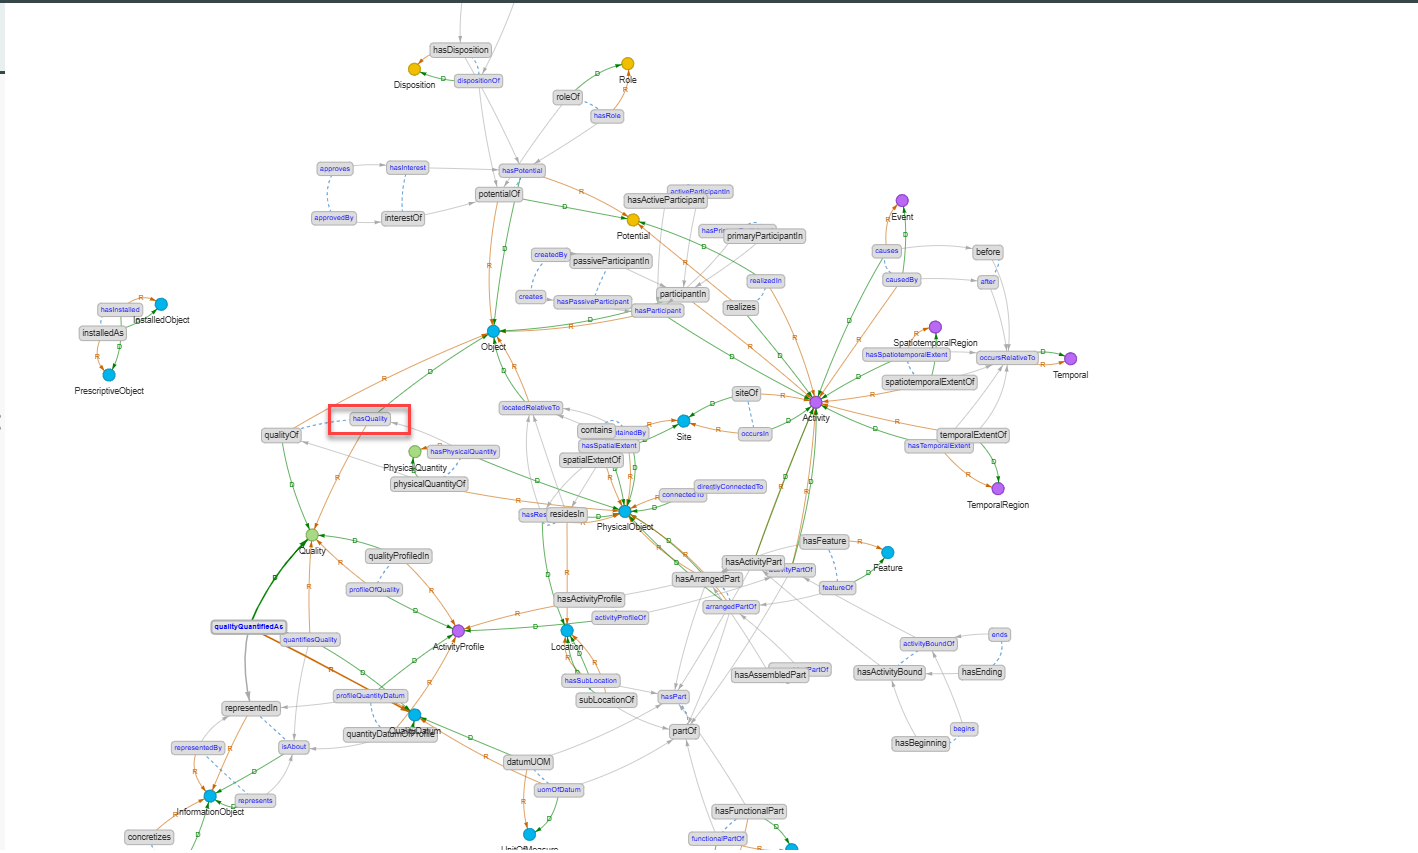
For the ‘hasQuality’ property, this means that every time ‘hasQuality’ is used, the domain (starting point) of this property should be an Object or a subclass of Object, and the range (target) should be a Quality or a subclass of Quality.
Node Infos#
When you right-click on a node in the graph or the tree, a popup will appear with the option NodeInfos.

NodeInfos can be displayed from several tools and provides information about the selected node.
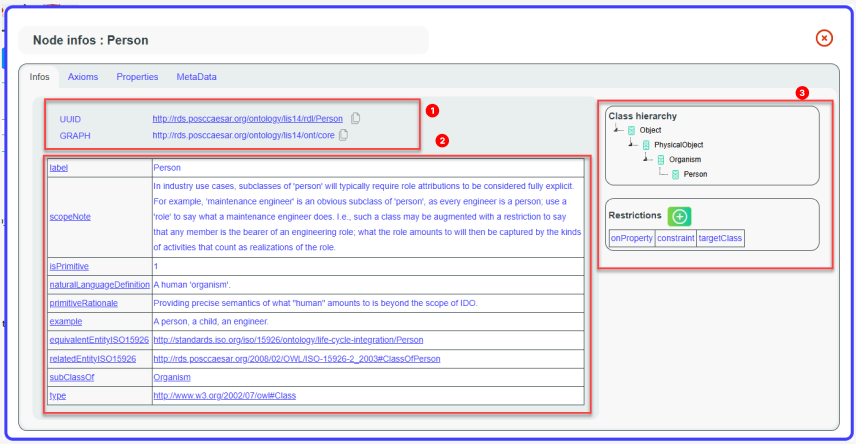
In the first tab, the first section (1) displays the URI of the resource and the graph URI to which it belongs. The second section (2) lists all the triples related to the resource. The third section (3) shows all inheritances of the resource (parents), applicable when the resource is a class or an individual, along with related restrictions. For properties, inheritance management is also handled via the rdfs:subPropertyOf property.
There are also different tabs. The Axioms tab displays the axioms of the resource graphically. For detailed documentation, refer to the “Show Axiom” use case.
The Properties tab shows all properties authorized for classes and individuals, whether the resource is considered as the property range or the property domain.
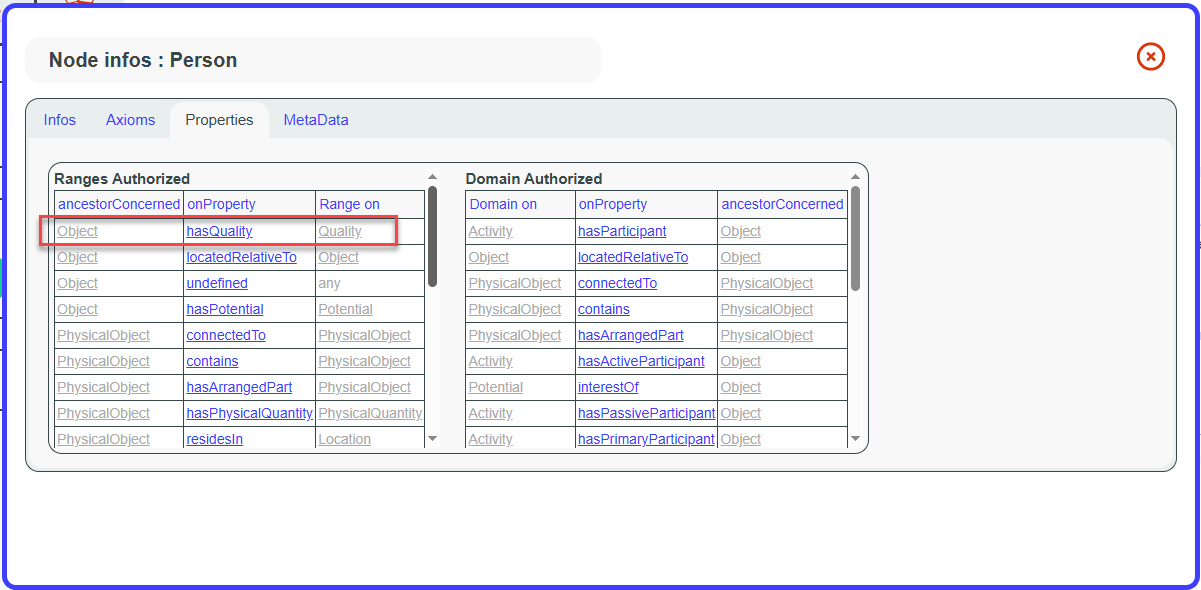
For example, Person has Object as an ancestor, so we can use the
property ‘hasQuality’ from the Person node to link to a node
with Quality as an ancestor.
The MetaData tab displays the SousLeSens metadata triples. These are
automatically created when you add a new resource through SousLeSens
tools (such as Lineage or MappingModeler).
The concerned properties are listed below:
status: “https://www.dublincore.org/specifications/bibo/bibo/bibo.rdf.xml#status”
status: “https://www.dublincore.org/specifications/bibo/bibo/bibo.rdf.xml#status”
provenance: “http://purl.org/dc/terms/source”
provenance: “http://purl.org/dc/terms/source”
creationDate: “http://purl.org/dc/terms/created”
creationDate: “http://purl.org/dc/terms/created”
mappingFile: “http://souslesens.org/KGcreator#mappingFile”
mappingFile: “http://souslesens.org/KGcreator#mappingFile”
SPARQL#
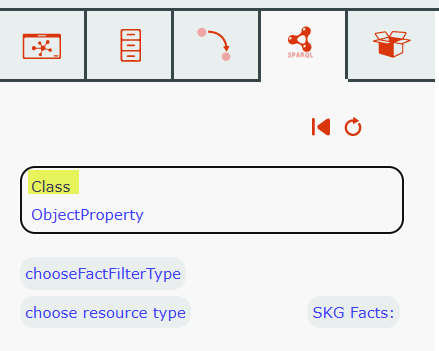
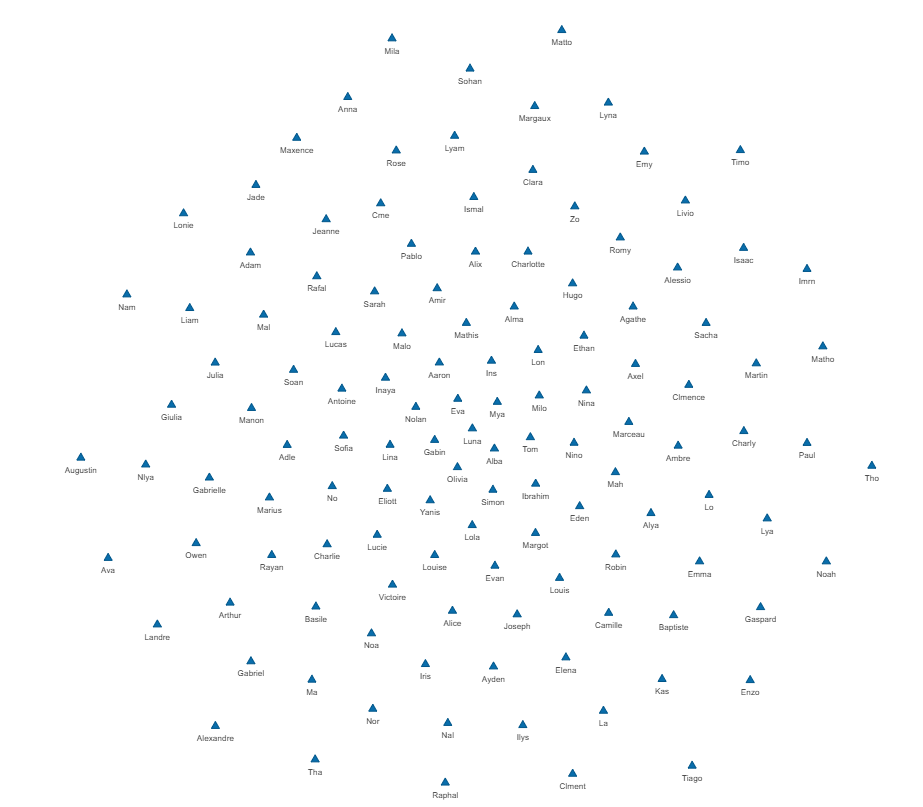
The SPARQL tab, when clicked, launches a bot that guides you in building a SPARQL query, which will then be displayed on the whiteboard. The bot’s questions are influenced by the content already present on the whiteboard. This feature is useful for exploring and visualizing individuals. The bot’s questions filter the individuals to prevent an overwhelming display of results and to keep the results understandable. You can choose to start from a property or a class to see the individuals related to your selection.
Choose Class
Click on Person , then any
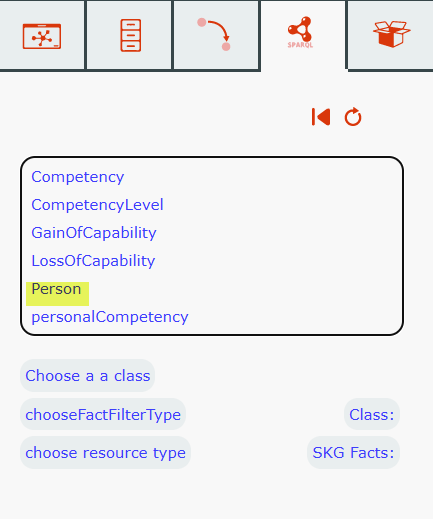

Choose the property that interests you from the Person individuals:
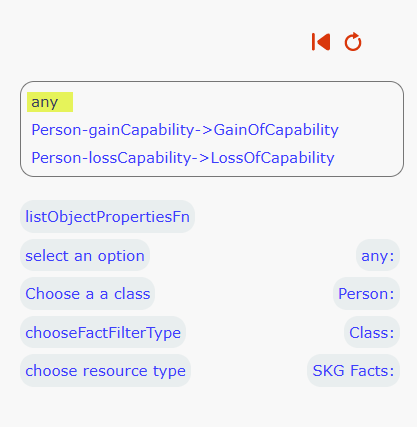
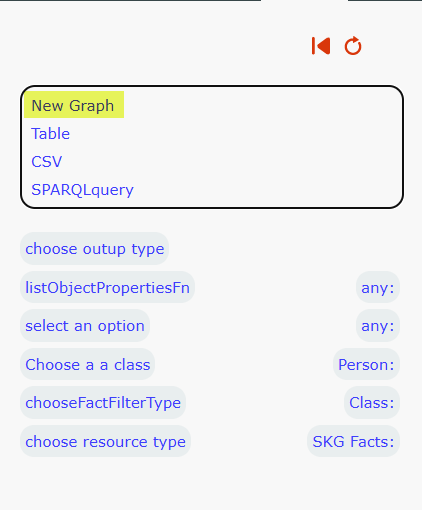
Finally, choose how you would like to receive the output.
Axioms and reasoner#
In the IOF-Core ontology, which contains many axioms, the Axioms tab displays a graphical representation of the axioms associated with a specific class, grouped by axiom type. The Show Triples option displays the triples corresponding to the displayed axiom.
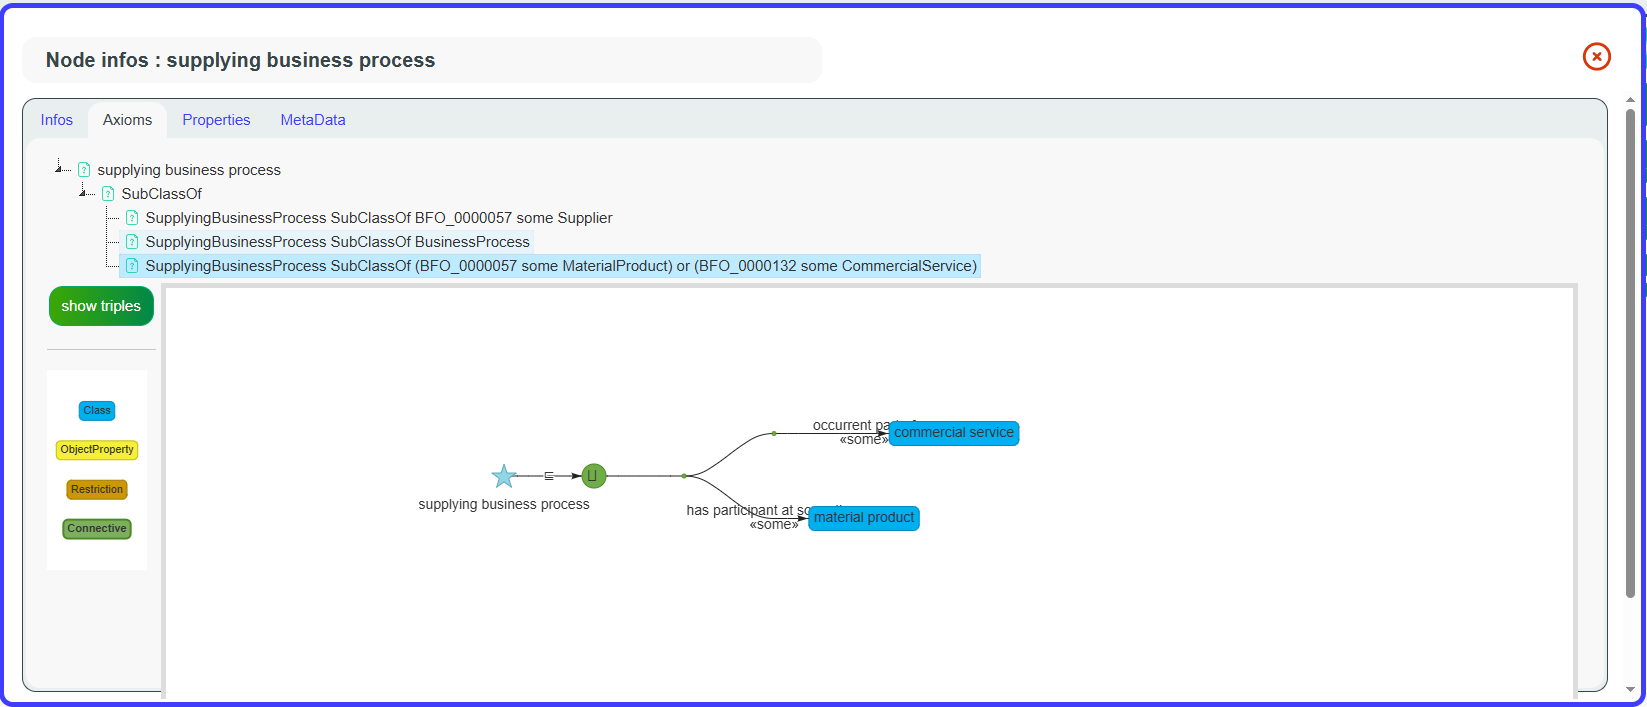
Export buttons are also provided in SVG and GraphML.